
Reading your VPS graphs
What this is for
The Graphs tab (in Manage VPS, https://vpsdime.com/myservices) plots how hard your VPS is working over time. It's the fastest way to answer three questions: is my plan the right size for what I'm running, is a slowdown caused by CPU, memory, disk, or network, and how much bandwidth am I using. Pick a time range with the buttons: Today, Yesterday, This Week, Last Week, This Month, Last Month.
Important: these are host-side graphs
These graphs are measured from the host (the hypervisor your VPS runs on), not from inside your VPS. That makes them great for trends and a quick health check without installing anything, but they can differ slightly from what tools inside the VPS report, and short spikes between samples may not show.
For accurate, detailed monitoring, run a monitoring agent inside the VPS. An agent sees per-process usage, real (non-cache) memory, application metrics, and can alert you. Easy options include Netdata (one-line install, live dashboard), or Prometheus node_exporter with Grafana if you already run that stack. Use the host graphs for the big picture and an in-VPS agent for the detail.
What each graph means, and what to do about it
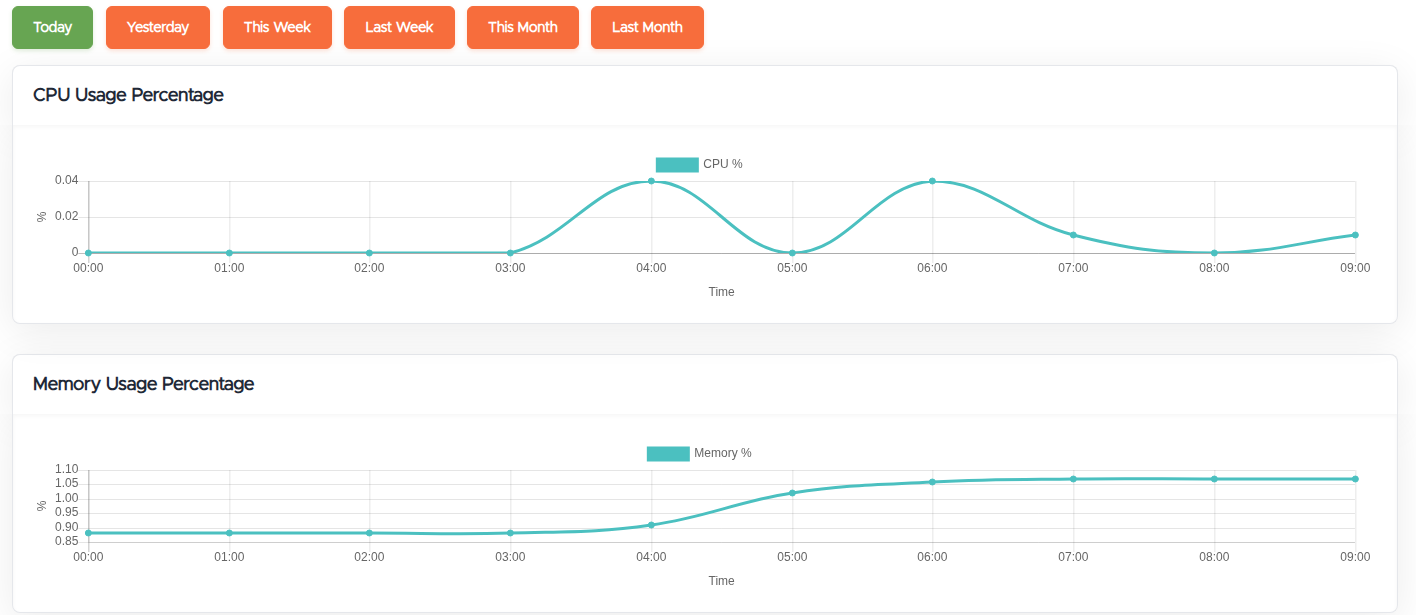
- CPU Usage Percentage. How much of your vCPU allocation is in use. Short spikes are normal. Sustained CPU near 100% means your workload is CPU-bound: either a runaway/misbehaving process, or your plan is too small for the load. Find the process with the in-VPS agent (or
top/htop); if it's legitimate and constant, upgrade. - Memory Usage Percentage and Memory Usage (Used / Available). RAM in use versus your limit. Consistently near the limit is the clearest sign you need more RAM, and running out risks the kernel killing your processes (OOM). One caveat: Linux uses spare RAM as disk cache, so host-side "used" can look higher than what your app strictly needs. The in-VPS agent separates cache from real usage, so check there before concluding you're short on RAM.
- Disk IOPS (Read / Write) and Disk Throughput (Read / Write, MB/sec). How hard your storage is being hit. High sustained IOPS or throughput points to a disk-bound workload (databases, search indexes, heavy logging) and can explain slowness even when CPU and RAM look fine. If this is your bottleneck, more CPU or RAM won't help, you likely need a storage-optimized plan or to reduce disk churn.
- Network Used Data / Traffic (Download / Upload). Bandwidth consumed over the period. Use This Month to see how fast you're burning through your monthly traffic allowance.
- Network Packets per Second (In / Out) and Network Throughput (In / Out, Mbps). Your live network rate. Useful for spotting a traffic spike, a busy service, or a possible attack.
Deciding whether to upgrade
Look at CPU, Memory, and Disk over This Week or This Month, not just this moment:
- Low most of the time means you have headroom (you may even be paying for more than you use).
- CPU or RAM repeatedly sitting near the limit during normal use means it's time to size up. On a Linux VPS this is painless: upgrades are live and instant with no downtime, no data loss, and your IP stays the same. See Upgrade/Downgrade.
- Only disk is high (IOPS/throughput or you're low on space): add storage rather than CPU/RAM, or move to a storage plan.
- Only bandwidth is high: buy extra traffic or upgrade rather than resizing CPU/RAM.
Troubleshooting a slowdown or a spike
- Switch to Today or Yesterday and line up the time the problem happened with the graphs.
- See which resource is pinned:
- CPU maxed → a runaway process or an under-sized plan.
- Memory maxed → memory pressure and swapping; expect sluggishness and possible OOM kills.
- Disk IOPS/throughput maxed → an I/O bottleneck; everything waits on the disk.
- Network maxed → a traffic flood, a busy service, or a possible attack.
- Confirm the cause inside the VPS with your monitoring agent and logs, then act (fix the process, add resources, or open a ticket with the timestamp and which graph was pinned).
Still need help?
You can open a support ticket. So we can help on the first reply, it's worth mentioning:
- the VPS hostname or IP,
- which graph looks wrong and roughly when (a screenshot of the Graphs tab helps),
- what you were running at the time.
Related questions
- "Where do I see my VPS CPU, memory, disk, and bandwidth usage?"
- "How do I know if I need to upgrade my VPS?"
- "My VPS is slow, how do I find the bottleneck?"
- "Are the graphs measured inside my VPS or on the host?"
- "How do I get accurate, per-process resource monitoring?"
- "How much bandwidth have I used this month?"
- "My memory graph is always high, do I need more RAM?"